Analysing the TILDA Data
The data can be analysed in multiple ways, depending on the requirements and your own preferences. The VISTA Platform has many statistical programs installed such as Stata, SPSS, RStudio, and SAS. There are also programming IDEs installed such as Visual Studio Code, IntelliJ IDEA and Eclipse.
Opening a dataset
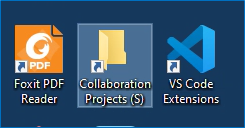
On your VISTA desktop there will be a folder called ‘Collaboration Projects (S)’.
Double click that to enter the folder. Here you will see folders for your projects.
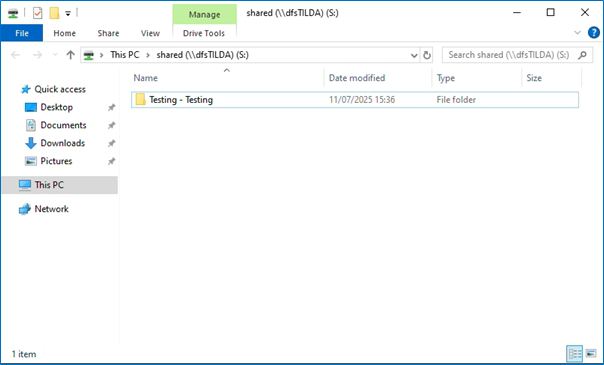
Double click a project folder to access associated documentation and datasets.
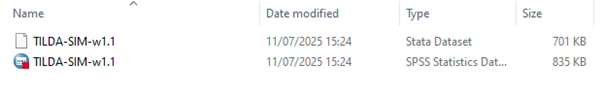
To open a dataset, navigate to the relevant folder. Double click the version you would like to open, the default options are Stata (.dta) and SPSS (.sav) datasets.
Stata Example Analysis
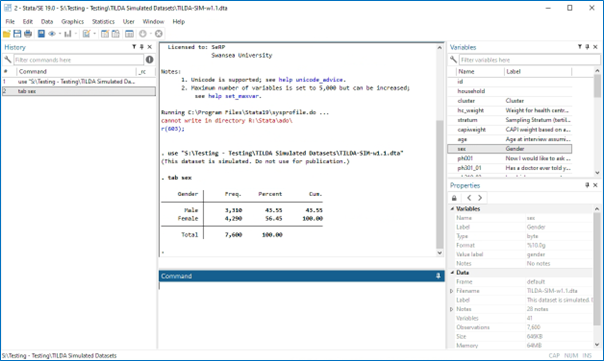
An example of a way to run analysis on the data is to use commands in Stata. When you open a .dta file it will open Stata and you will see different windows, including the ‘Command’ window.
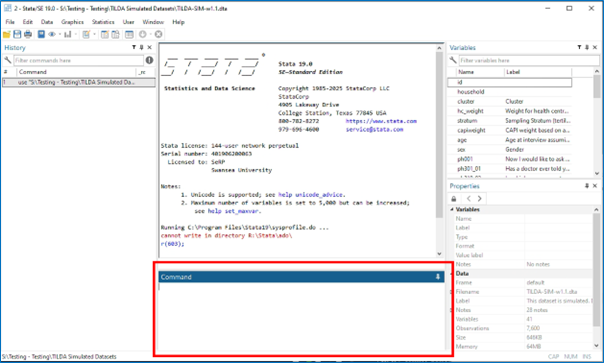
Commands can be entered here to analyse the data. For example if we type ‘tab sex’ in the command window and press Enter, a gender frequency table will be produced.
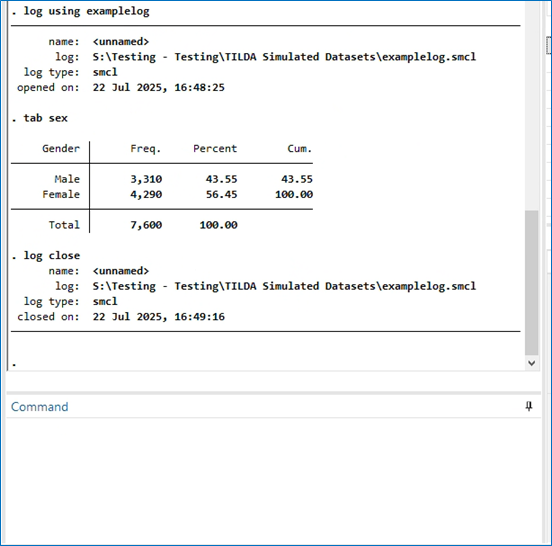
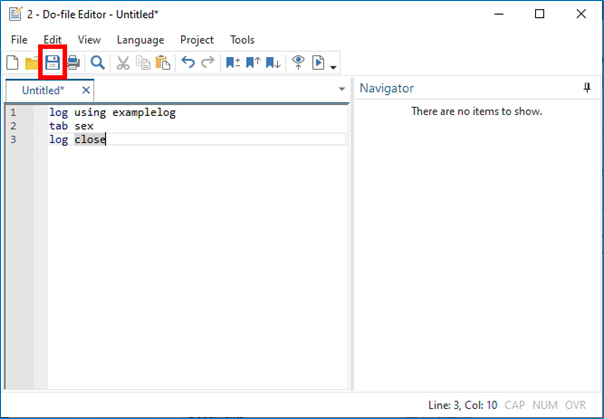
To log this output we can first use the log command ‘log using examplelog’ where examplelog is the file name. To finish the log file we use ‘log close’.
Stata Code Files Example
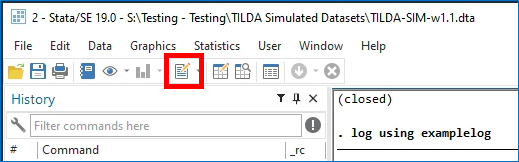
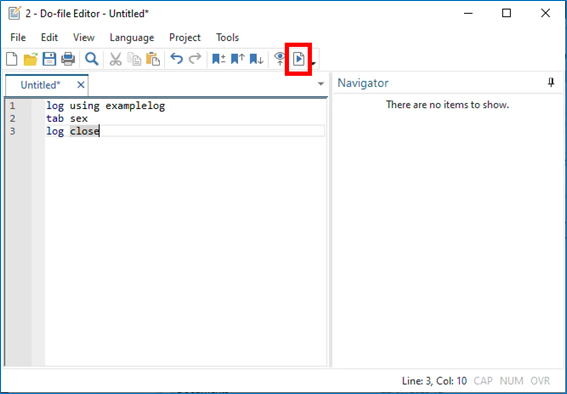
To be able to write, edit, retrieve and rerun code, it is a good idea to use code files. For example a .do file in Stata. To create a .do file click the ’New Do-file Editor button.
This will open a new window where commands can be entered on each line and saved. This code can then be run together. To run the code, click the ‘Execute (do)’ button.
To save the file press Ctrl + S or click the ‘Save’ button.
Type a name for the file and then click ‘Save’.